English

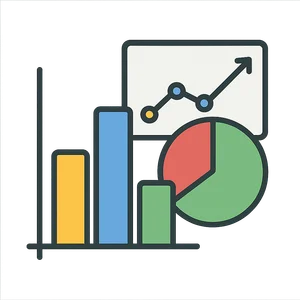
Charts and Graphs (Showing Data in Pictures)
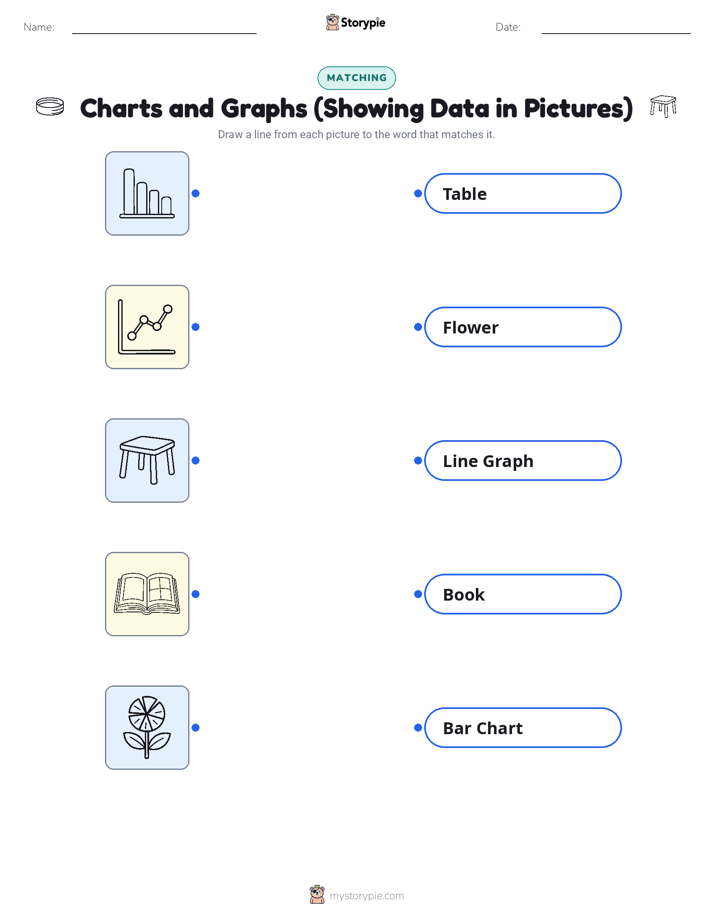
Charts and graphs are visual tools that turn numbers and data into simple pictures, like bar charts…
Reads at Pre-K Listens at Pre-K–1
Print & create
Answer keys·No prep·Free with an account
28 worksheets · answer keys · full story · quiz · Ages 3-5 · CEFR A1
Plus adds 244,000+ more stories in 27 languages, audio for every one, and printables for all of them.
Just want Charts and Graphs (Showing Data in Pictures)?

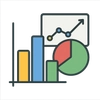
Do you ever have a big pile of colorful blocks. What if you wanted to show your friend which color you have the most of, without counting every single one. That’s where I come in. I turn big piles of numbers and ideas into a simple picture. I can look like colorful towers standing side-by-side, or a yummy pizza cut into slices. I help you see the answer with just your eyes. I am Charts and Graphs.
Long, long ago, people only had long lists of numbers, which could be very confusing. But then, in the year 1786, a clever man named William Playfair drew me for the first time in a book. He made me look like tall bars to show how things grew or shrank. A little later, in 1801, he made me look like a circle, or a pie, to show all the parts of one big thing. Then, in the 1850s, a very kind nurse named Florence Nightingale used me to help people. She used a special circle picture to show doctors how to keep soldiers healthy. My picture helped save so many lives.
Today, I'm everywhere and I love to help. I can show you if it will be sunny or rainy this week. I can show you who is winning a race or which snack is the favorite in your class. I take tricky numbers and turn them into a picture story that's easy to understand. The next time you see a colorful chart, you’ll know I’m there, helping you see a whole story in one quick peek.
The Picture That Tells a Story
Do you ever have a big pile of colorful blocks. What if you wanted to show your friend which color you have the most of, without counting every single one. That’s where I come in. I turn big piles of numbers and ideas into a simple picture. I can look like colorful towers standing side-by-side, or a yummy pizza cut into slices. I help you see the answer with just your eyes. I am Charts and Graphs.
Long, long ago, people only had long lists of numbers, which could be very confusing. But then, in the year 1786, a clever man named William Playfair drew me for the first time in a book. He made me look like tall bars to show how things grew or shrank. A little later, in 1801, he made me look like a circle, or a pie, to show all the parts of one big thing. Then, in the 1850s, a very kind nurse named Florence Nightingale used me to help people. She used a special circle picture to show doctors how to keep soldiers healthy. My picture helped save so many lives.
Today, I'm everywhere and I love to help. I can show you if it will be sunny or rainy this week. I can show you who is winning a race or which snack is the favorite in your class. I take tricky numbers and turn them into a picture story that's easy to understand. The next time you see a colorful chart, you’ll know I’m there, helping you see a whole story in one quick peek.
Wow facts
About
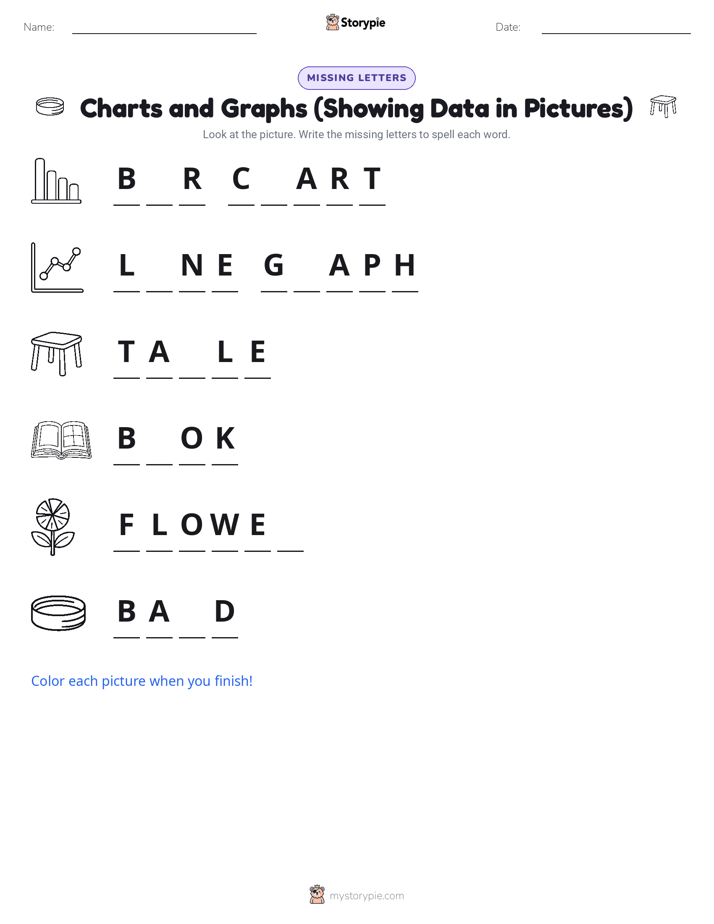
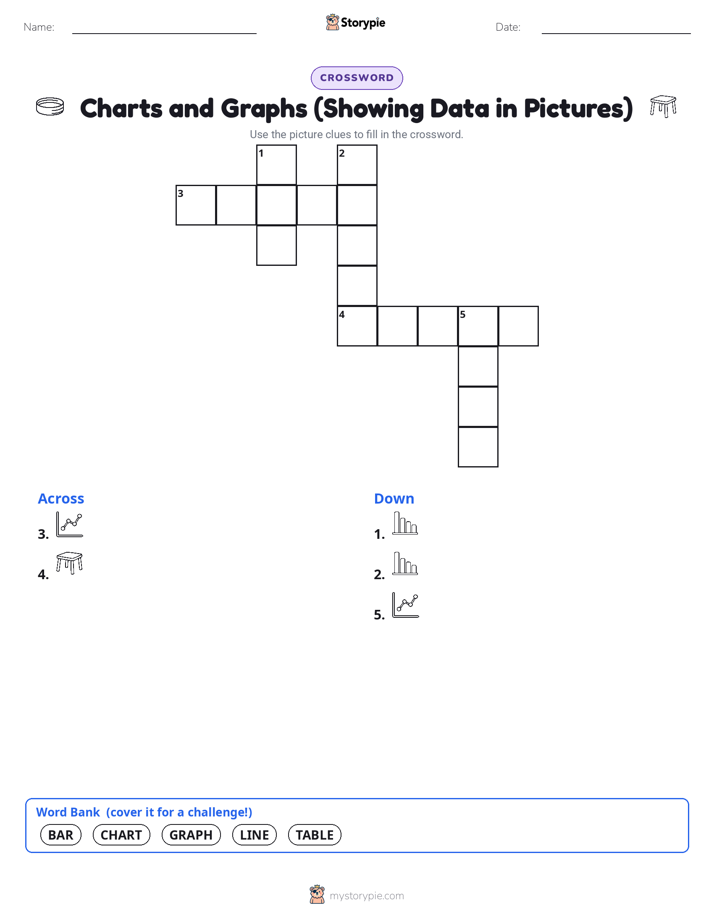
Charts and graphs are visual tools that turn numbers and data into simple pictures, like bar charts, line graphs, and pie charts, making information easier to understand.
Take a Quiz
Question 1 of 3
Who was this story about?
Explore next






Want to do even more?
Go beyond exploring. Unlock tools that turn every story into real learning.

Storypie Plus for families
Full stories, quizzes, and printables. Nights and car rides, sorted.
- Unlimited audio stories
- Create Mode: your child stars in the story
- Offline downloads
- Printable worksheets & coloring pages

Why Storypie for Schools
Students engaged. Prep in seconds. Evenings back to you.
- Worksheets & Quizzes
- Classroom Management
- Formative Assessment
- Custom Curriculum & Lesson Plans
- 27 Languages

Why Storypie for Homeschool
Curriculum done. They'll ask for more. Hours back in your day.
- Worksheet Generator
- First-Person Audio Stories
- Built-in Comprehension Quizzes
- Custom Curriculum & Lesson Plans
- Print & Go Activities